
Belonging and Flourishing Council
The Belonging and Flourishing Council will work to build a campus culture where all members are welcome, feel included, and have a sense of belonging and flourishing. It will work to shape and contribute to university-wide efforts and initiatives to achieve strategic objectives in belonging, wellbeing, and engagement and flourishing, and provide a forum for Council members to meet each month to discuss their initiatives, exchange ideas, and learn about resources to advance these goals for all members of the university community. The Council’s membership is drawn from a group of leaders from faculty, staff, and students. If you have any questions for the Council, contact ibelong@arcadia.edu.
Belonging and Flourishing at Arcadia:
- Enriches our understanding and learning of others;
- Establishes a culture of respect so that our uniqueness is seen as an asset and we treat others the way we would like to be treated;
- Supports the sense of safety of our community members in providing timely responses to concerning behaviors and actions that could be in violation of community standards, policies, and the law;
- Supports the well-being needs of all students, staff, and faculty;
- Builds avenues for students to connect with faculty, staff, and alumni in meaningful ways.
Student and Community Member Resources
- Alumni Engagement
- Campus Life
- Career Education
- CASAA
- Civic & Global Engagement
- Commuter Students
- Counseling Services
- Division of Student Success
- First-Generation Students
- Interfaith Space and Spirituality (Also: see Religious Accommodation policy)
- Knights Resource Pantry
- Living and Commuting at Arcadia, including inclusive housing
- Office of Equity and Civil Rights
- Office of Sexual and Gender Based Violence Prevention and Education
- Student Success
- Well-Being


Accessibility & Disability
Arcadia works to support students with disabilities or those seeking accommodations. Visit Disability Support Services or learn about Arcadia’s Accessibility Concerns for more information.

Programming
We develop, implement, and collaborate with others at Arcadia and beyond to provide and support engaging programs that deepen, celebrate, and support our understanding of the unique experiences of others. Visit our events calendar or Arcadia’s weekly newsletter to learn of Belonging and Flourishing-related events on campus; if you have a programming idea, let us know.
Additional Resources
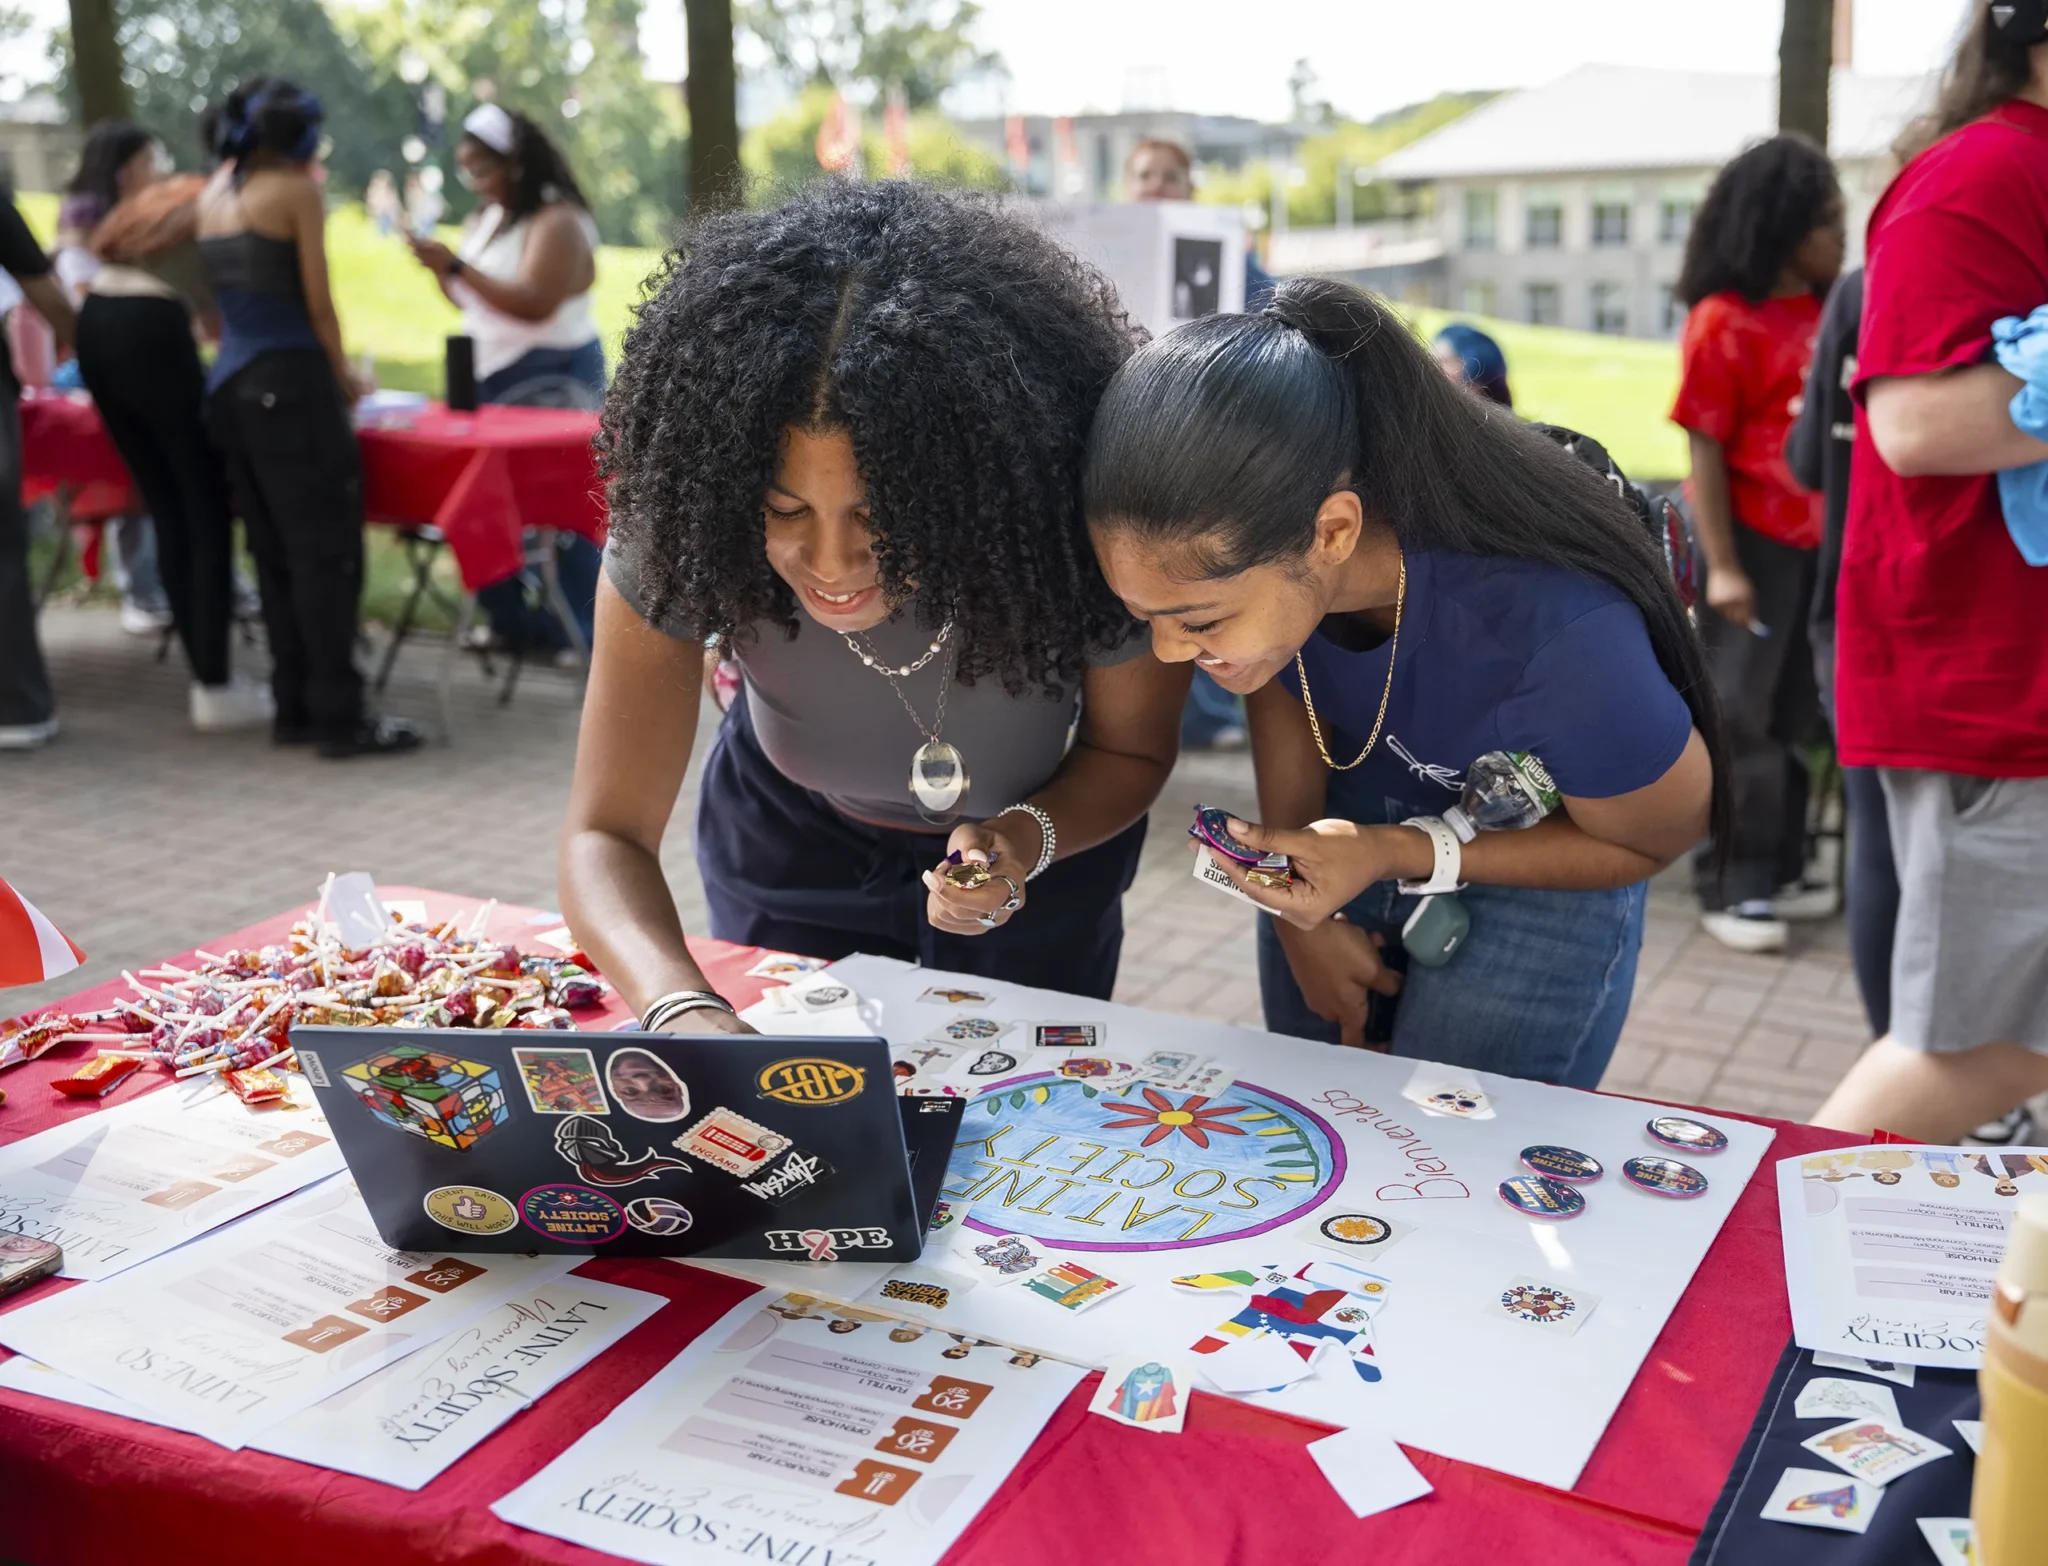
Arcadia also has several additional campus groups and support services available and open to all students and community members, including but not limited to, the AU Asian Pacific Islander American Alliance, Black Awareness Society, Black Alumni Association of Arcadia University, Latine Society, Hispanic/ Latinx Alumni Association of Arcadia University, and Queer and Trans Students of Color and Allies. Contact iBelong@arcadia.edu if you’d like to learn more about these or any other additional resources available, or if you’re interested in forming a resource or support group.
Using a Chosen Name at Arcadia
Any Arcadia University student, faculty, or staff member may choose to be identified within the University community with a chosen first name that may differ from the individual’s legal first name. Honoring and facilitating the use of an individual’s chosen name is a critical way for Arcadia to remain an inclusive and welcoming environment.
Arcadia students who wish to use a chosen first name should initiate this process on the Chosen Name and Personal Pronouns Request Form. A person’s chosen first name will appear instead of, or in addition to, the person’s legal first name in University-related systems and documents where it is technically feasible and where the use of the legal first name is not required by or necessary for University business or any legal need. The offices that are responsible for updating systems that reflect chosen names will be the only offices who receive this form from students. The University systems below will reflect the chosen name in their systems within 30 days after the form is submitted.
*Students may also use this form to edit their own Personal Pronouns.
Arcadia faculty and staff who wish to use a chosen first name should initiate this process by contacting Human Resources at humanresources@arcadia.edu.
Once the Chosen Name and Personal Pronouns Request Form has been submitted, your approved first name will be changed in the following systems:
- Accudemia
- Canvas
- Arcadia Email Display Name/Email Address
- Zoom Display Name (additional steps required)
- SendWordNow
- KnightLife
- MyKnight Portal
- Self-Service
- Libcal
- KnightCard (additional steps required)
- Landman Library
- Diploma (additional steps may be required)
- CareerLaunchPad
- Medicat (Patient Portal) (will appear as “Legal First Name (Chosen Name) Last Name”
- GET APP
- MCR Housing- automated integration (housing application/ system
Due to the legal nature of reporting grades and financial aid information, certain administrative systems will retain an individual’s legal first name. These include:
- Academic Transcripts
- Payroll/iSolved
- Employment Verification and Documents
- Student Financial Aid
- Insurance Information
- National Student Loan Data System
- Reporting to any entity external to Arcadia
The University is only able to amend systems to reflect an individual’s chosen first name. Systems must reflect an individual’s legal last name. For individuals who wish to legally change the name that appears on their birth certificate, including their first, middle, and/or last name, please visit the information page.
