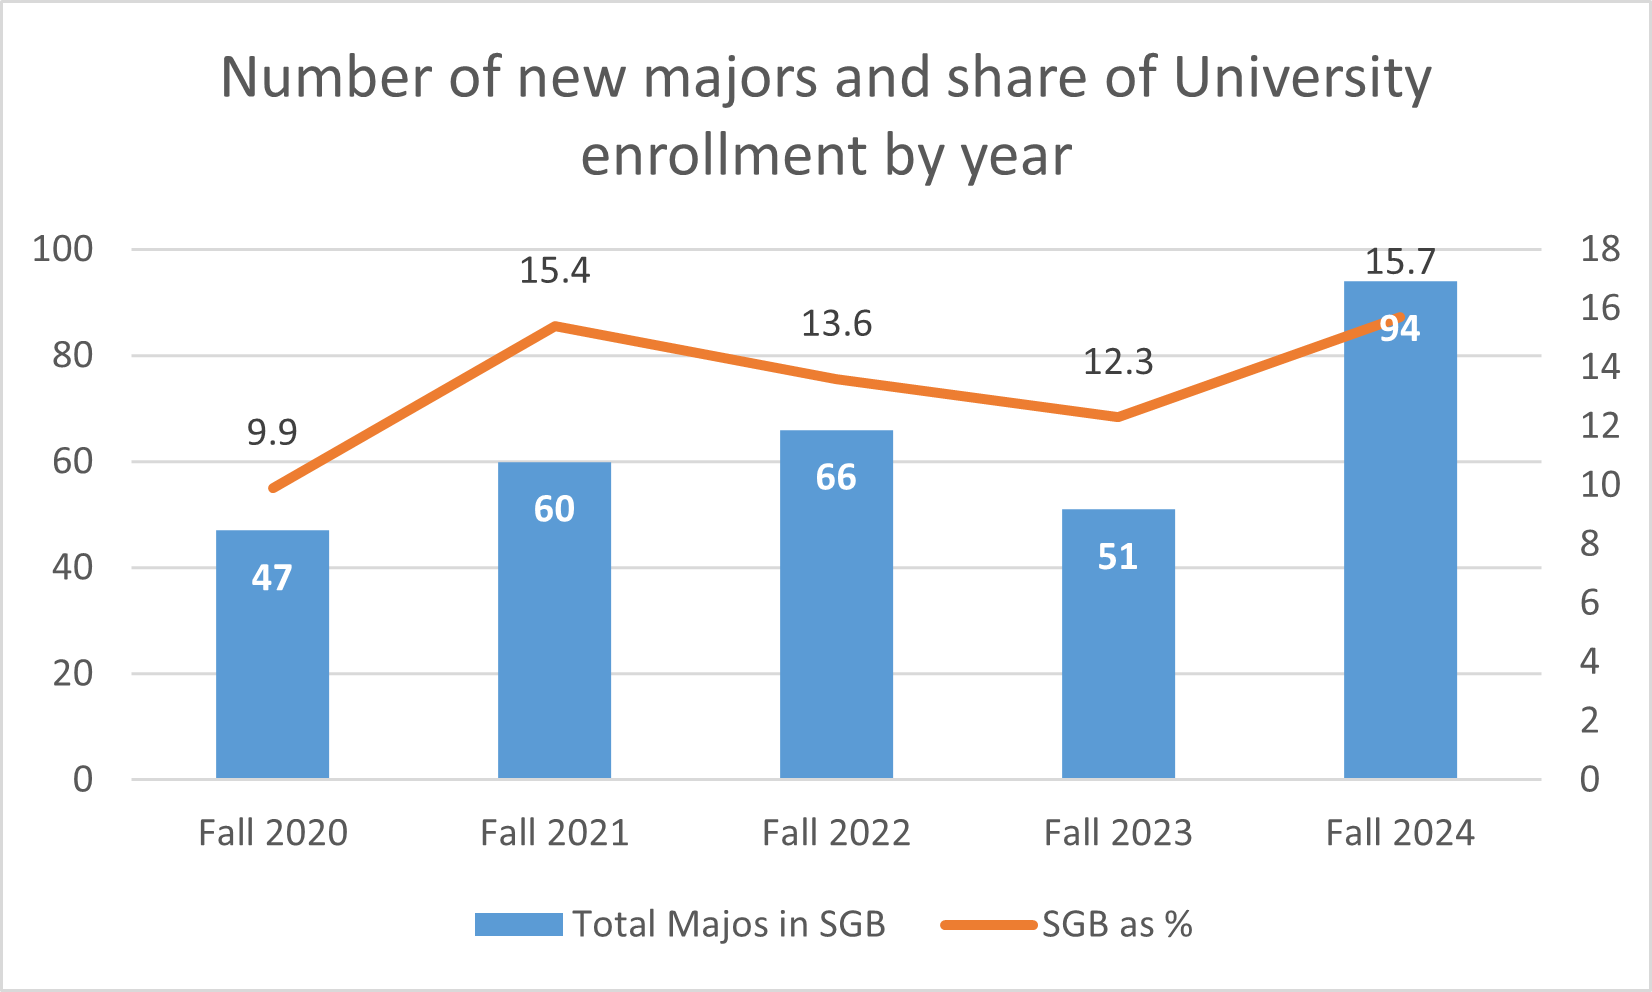
The graph represents the total number of majors within SGB (numbers) and the proportion of SGB majors among all incoming first year students to the university (%) for the years 2020-2024
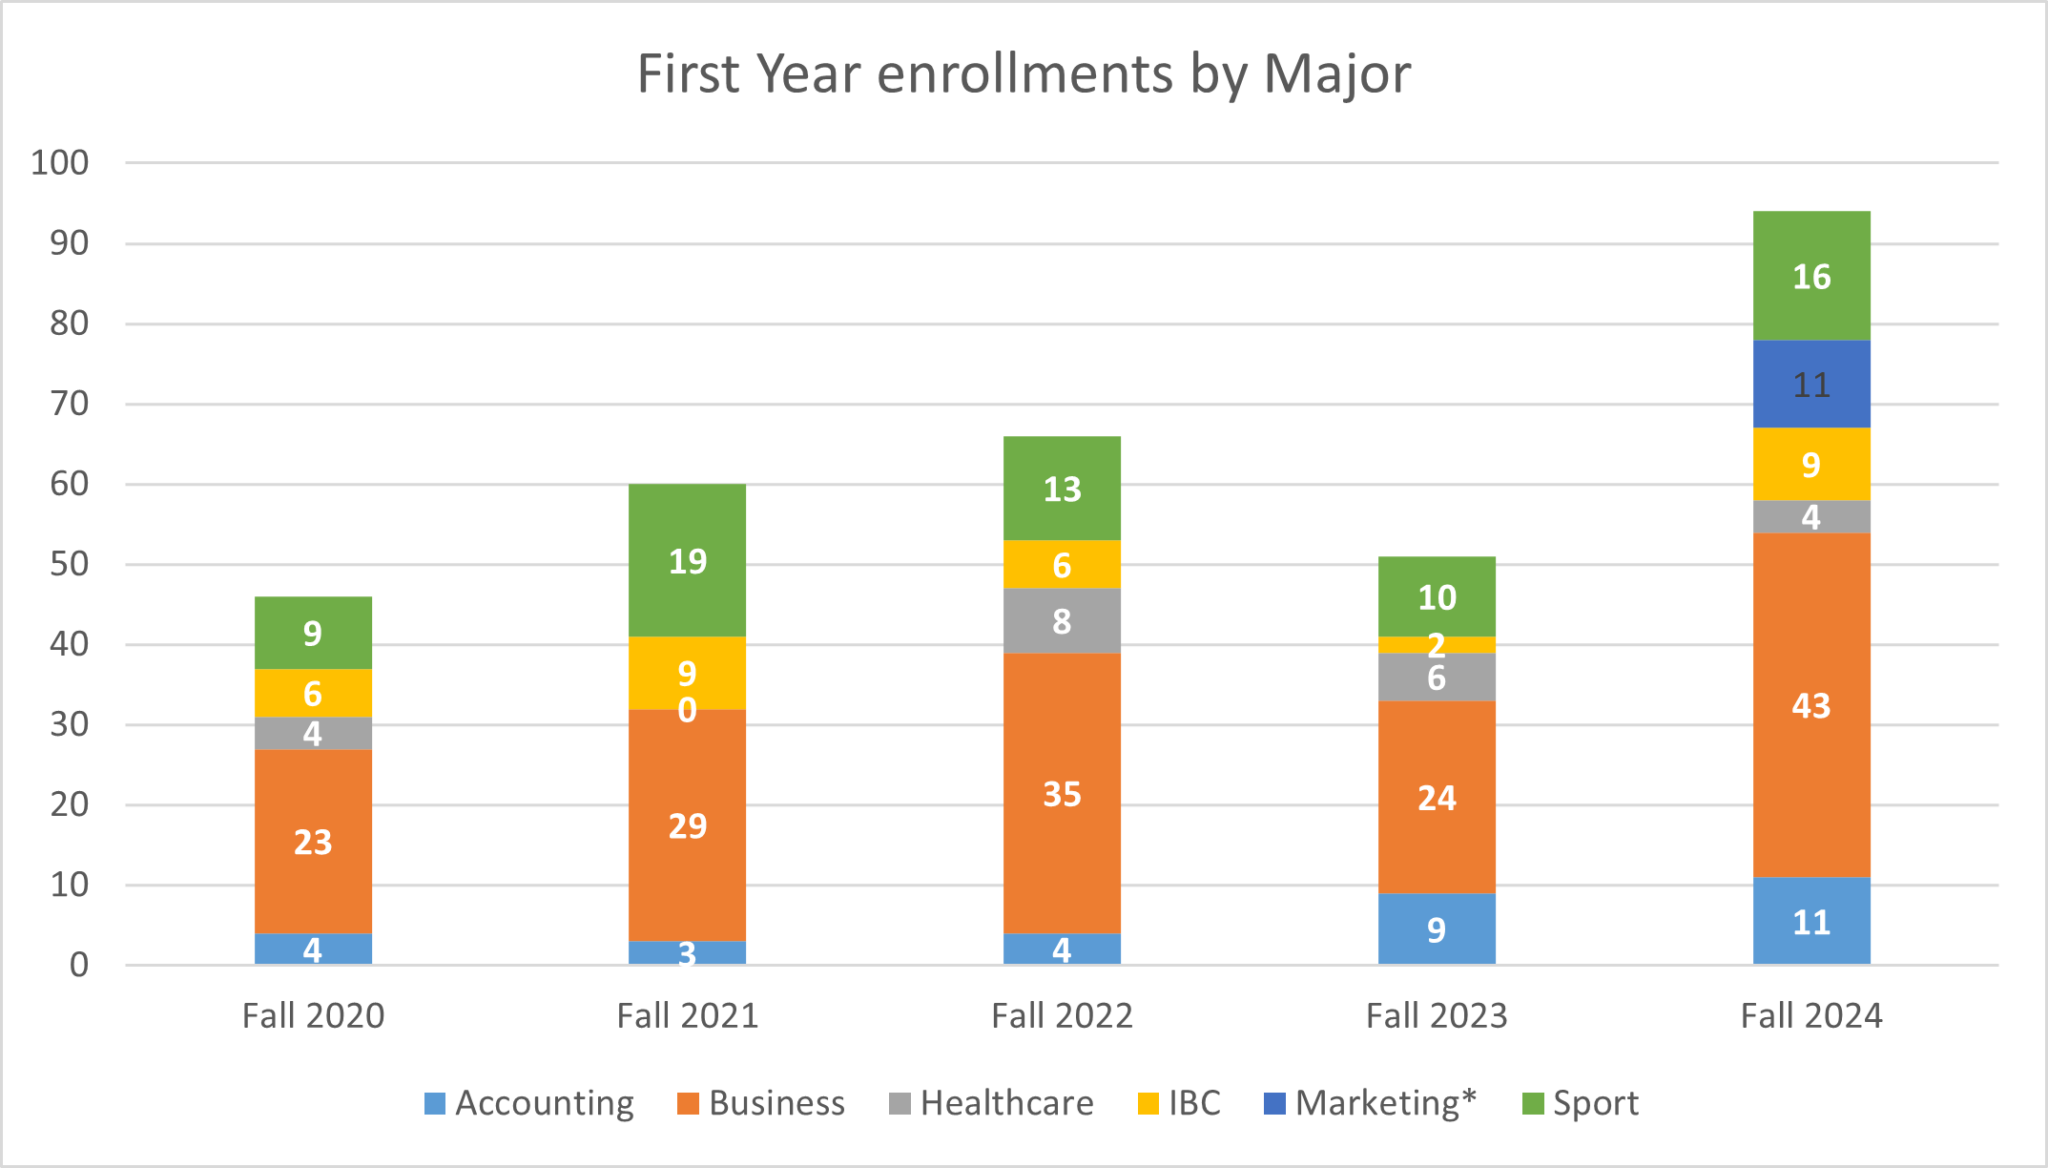
This graph shows the total number of incoming students within the School of Global Business for the Academic Years 2020-2024 by major
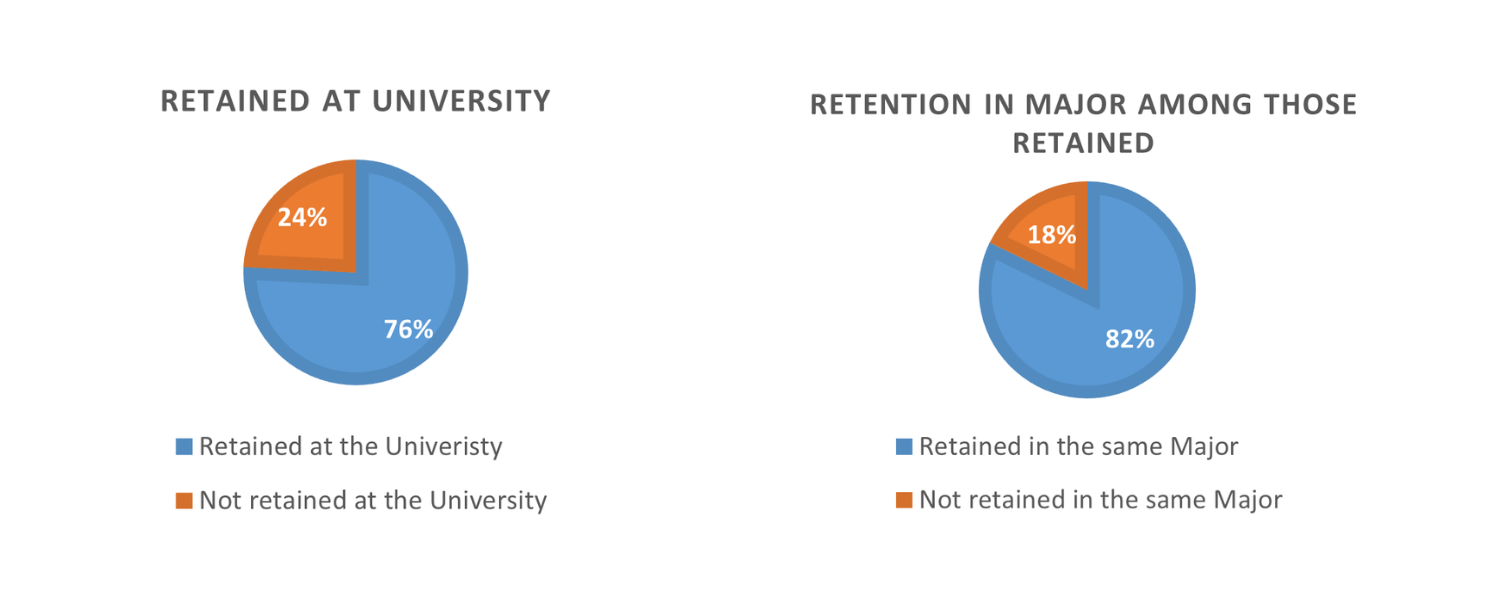
These charts show the total retention rate at Arcadia University versus those who were retained in their major upon arrival at the university.
View details of Undergraduate Student Outcomes. It will bring you to data from the Office of Career Education and shows data on employment trends 6-9 months after graduation, graduate school majors, and top locations for our graduates.
- Tables for Standard 3 (AQ Report, 2025) – Student and Stakeholder Focus
- Tables for Standard 4 (AQ Report, 2025) – Student Learning Outcomes
